The EZView widget queries and downloads EQuIS reports and creates EQuIS Information Agents (EIAs) to automatically send reports. EIAs for grid reports can also be a data source for the widget. Use the widget to run the selected report and then export the report output to third party programs, such as Microsoft Excel (.xls) workbooks, Esri ArcGIS shapefiles (.shp), tab delimited (.txt) files, and Google Earth (.kmz) files. The Share button allows users to generate a link to the report for use in Esri ArcGIS Online or Microsoft Power BI. Add reports to a Map widget by dragging the report name from the EZView widget onto the map.
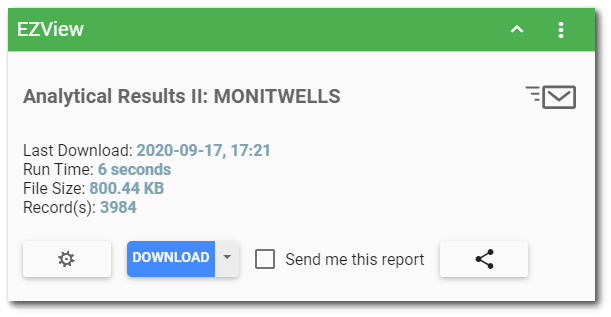
If EIA(s) are defined for the widget, an envelope icon is displayed in the upper right corner. Hover over the envelope icon to see how many EIAs are defined for the EZView widget. The left side of the widget displays the following:
Report Name – The name of the selected report.
Last Download – The date/time (end-user browser local time) that the report was last downloaded.
Run Time – The run time (i.e., elapsed time) indicates how long it took the report to run the last time it was downloaded (excludes download time).
File Size – The file size of the report output the last time it was downloaded.
Record(s) – If applicable, the number of records in the tabular output of the report the last time it was downloaded.
View/Edit Data
If the option to enable a link to the Report Parameter Editor is selected in the widget properties, the Edit ![]() icon will appear on the EZView widget to the left of the Download button. Clicking this icon opens the Report Parameter Editor in ad hoc mode, allowing a user to edit and download reports without saving an additional user report. Depending on the user's permission for the selected report, the user can do the following:
icon will appear on the EZView widget to the left of the Download button. Clicking this icon opens the Report Parameter Editor in ad hoc mode, allowing a user to edit and download reports without saving an additional user report. Depending on the user's permission for the selected report, the user can do the following:
•view/edit the report parameters
•run the report with the selected parameters
•save the report or create a new report
Download or Send Data
To export the report output, click on the Download button to open a drop-down menu with output options, detailed below.
|
To receive the report directly (via email or to the Notice widget), click to check Send me this report, then select the report format.
|
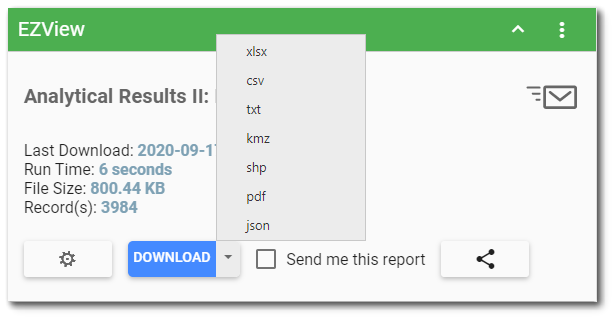
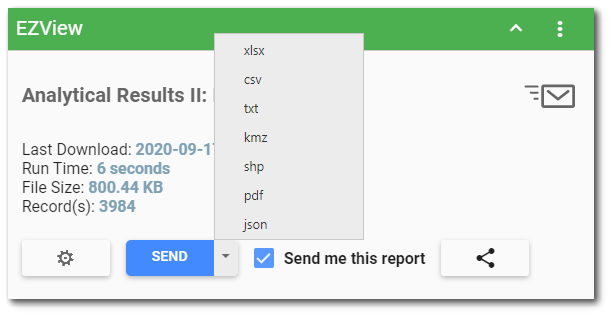
The following file types are available for export:
•.xlsx – Microsoft Excel workbook containing the tabular data.
•.csv – Comma-separated, double-quote delimited text file containing the tabular data.
•.txt – Tab-separated text file containing the tabular data.
•.kmz – Google Earth kmz file containing Placemarks for each location and a balloon pop-up with the tabular data for that location.
•.shp – A .zip file containing the Esri Shapefile (locations as features) and other related files (*.dbf, *.prj, etc).
•.pdf – A Portable Document Format (PDF) file displaying the tabular data.
•.json – JavaScript Object Notation (JSON) for grid data (e.g. IGridReport).
Note: The PDF output is produced by generating default Report Definition Language (RDL) to display the table of data and rendering that RDL as .pdf file. For more information on customizing the default RDL used for displaying grid report data, see Default RDL Template. |
|---|
RDL Reports
A published RDL Report will show two download options:
•xlsx – The Microsoft Excel workbook produced by the published RDL as rendered by Microsoft's ReportViewer control.
•pdf – The PDF output produced by the published RDL as rendered by Microsoft's ReportViewer control.
For more information on RDL reports, see Designing RDL Reports and Publishing RDL Reports.
"Class" Reports
A non-grid report will only display the download option for the file type that it generates. For example, the "Google Earth: Locations" Report only generates *.kmz files, so only the .kmz option will be available.
Crosstab Reports
Crosstab reports can be downloaded from the EZView widget like any other report. See the Creating Excel Templates article for configuration details on crosstab templates.
Share Report
If the user has Viewer permission and a report is selected, the EZView widget displays a Share ![]() button. Share generates a link to the report for use in Esri ArcGIS Online or Microsoft Power BI. The link includes a user token with a configurable expiration. Users can then share key EQuIS information with others via a URL. The recipient does not need to have EQuIS installed or a license to view the information. For the URL token to be valid, the following must be in place:
button. Share generates a link to the report for use in Esri ArcGIS Online or Microsoft Power BI. The link includes a user token with a configurable expiration. Users can then share key EQuIS information with others via a URL. The recipient does not need to have EQuIS installed or a license to view the information. For the URL token to be valid, the following must be in place:
•access to REST API licenses through the EQuIS database
•deployment of a REST API License role to the EQuIS Enterprise site
•assignment to the REST API role for the user creating the share URL
Note: The Share feature only works with user reports. It does not work with EIAs as a data source. |
|---|
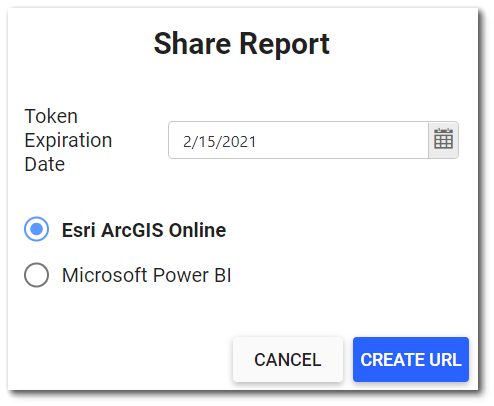
Click the Share ![]() button to open the Share Report dialog window and generate the user token:
button to open the Share Report dialog window and generate the user token:
1.Use the calendar tool to select a Token Expiration Date.
2.Click Create URL to open a dialog window displaying the token value. This is the only opportunity to view and copy the token value.
3.Click the Copy button to automatically copy the token URL value to the clipboard and be available to share with others. The Close button will close the window.
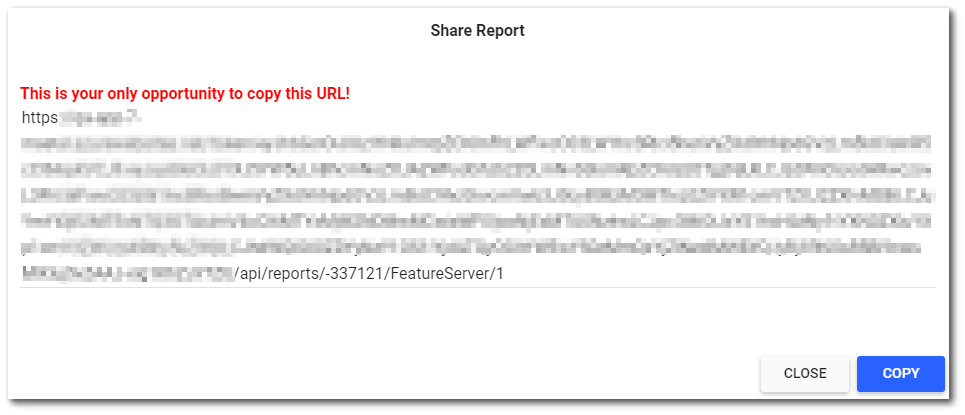
Warning: This is the only opportunity to copy the token URL value. After closing the Share Report window, the token value will not be accessible, and a new token will need to be created. |
Widget Properties
In the Widget Editor, users can select a report, configure the report, and create EIAs. To add a report or edit other widget properties, open the Widget Editor by selecting More Options ![]() > Edit in the Widget Header.
> Edit in the Widget Header.
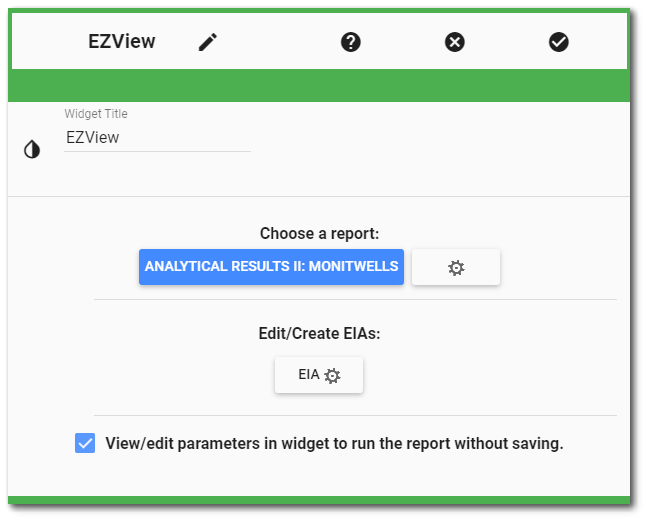
Widget Title – By default, the widget title is EZView. The title can be modified.
Widget Theme![]() (next to the Widget Title) – Change the widget color.
(next to the Widget Title) – Change the widget color.
Report Chooser – Select the report or EIA (as a data source) to be used with this instance of the EZView widget. The name of the currently selected report (if applicable) is displayed by default. To select a different report or EIA, click the Choose a Report button or name of the report. The Report Chooser will open and display available reports.
Report Parameters – Click the Edit button ![]() to open the Report Parameter Editor for the selected report and edit the report parameters (e.g., analytes, sample date range, etc.). A user with Editor permission on the selected report may update the report.
to open the Report Parameter Editor for the selected report and edit the report parameters (e.g., analytes, sample date range, etc.). A user with Editor permission on the selected report may update the report.
Edit/Create EIAs – Select the EIA ![]() button to create or edit an EIA. For a detailed discussion of EIAs, see the EQuIS Information Agents chapter.
button to create or edit an EIA. For a detailed discussion of EIAs, see the EQuIS Information Agents chapter.
View/edit parameters in the widget to run the report without saving – Check this option for a direct link to the Report Parameter Editor ![]() from the widget. Depending on the user's permission for the selected report, the user can view/edit the report parameters, run the report with the selected parameters, and save the report or create a new report.
from the widget. Depending on the user's permission for the selected report, the user can view/edit the report parameters, run the report with the selected parameters, and save the report or create a new report.
Object Editor ![]() – Set various appearance properties of the widget via the Widget Object Editor.
– Set various appearance properties of the widget via the Widget Object Editor.
Help ![]() – Launch online documentation for the widget.
– Launch online documentation for the widget.
Copy Settings ![]() – Copy widget settings from another widget of the same type.
– Copy widget settings from another widget of the same type.
Close without Saving ![]() – Exit the Widget Editor without saving changes.
– Exit the Widget Editor without saving changes.
Save ![]() – Apply Changes and close the Widget Editor.
– Apply Changes and close the Widget Editor.