The Probes Manager logger interface in EDGE provides the versatility of selecting from a variety of models of the same logger, at the same time allowing for differentiating between data import loggers and live loggers.
The Probes Manager is launched each time a data logger is selected from the Devices ribbon.

For example, when the In-Situ logger option is selected, the Probe Manager presents a selection of all In-Situ sensor models supported by EDGE.
Select Sensor
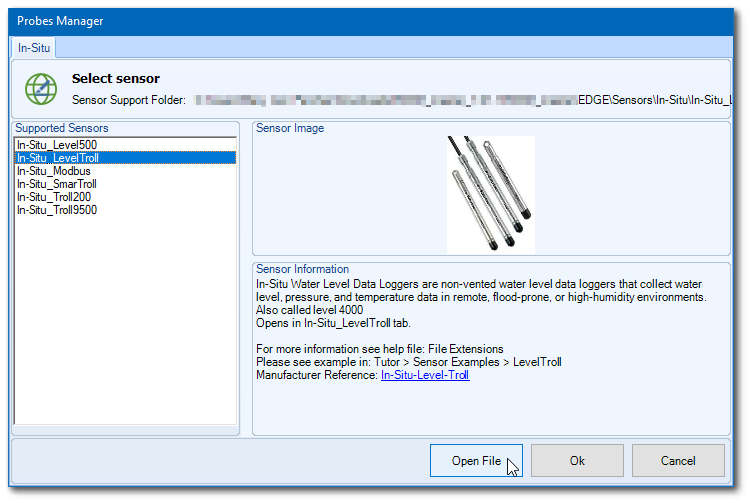
The Select Sensor option appears. In the example below, the selected In-Situ_LevelTroll provides the option of opening the data file associated with this logger. Information about where the example data files are located is visible in the Select Sensor window (typically data files are available in EDGE in the \EDGE\Example\SensorExamples folder).
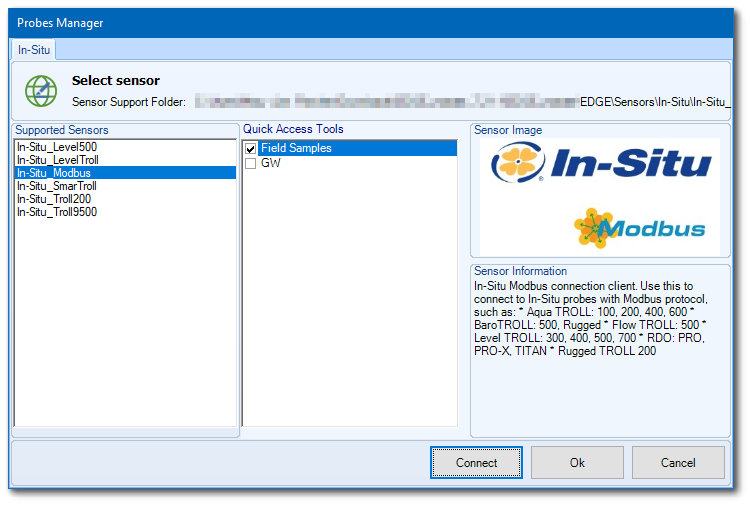
If a live sensor is chosen, such as Modbus in the example below, an additional option is presented to the user allowing for connection to the live sensor and importing data in real time. The data can be imported in any of the EDGE tabs that support data import, as these are selected by the user. In this example, two EDGE tabs are available and the Field Samples tab was selected to import data from the live sensor.
Once the Connect button is selected, a sensor interface will display, where manipulation of data import, probe and sensor details, and remapping options are available.
Imported Data Tab
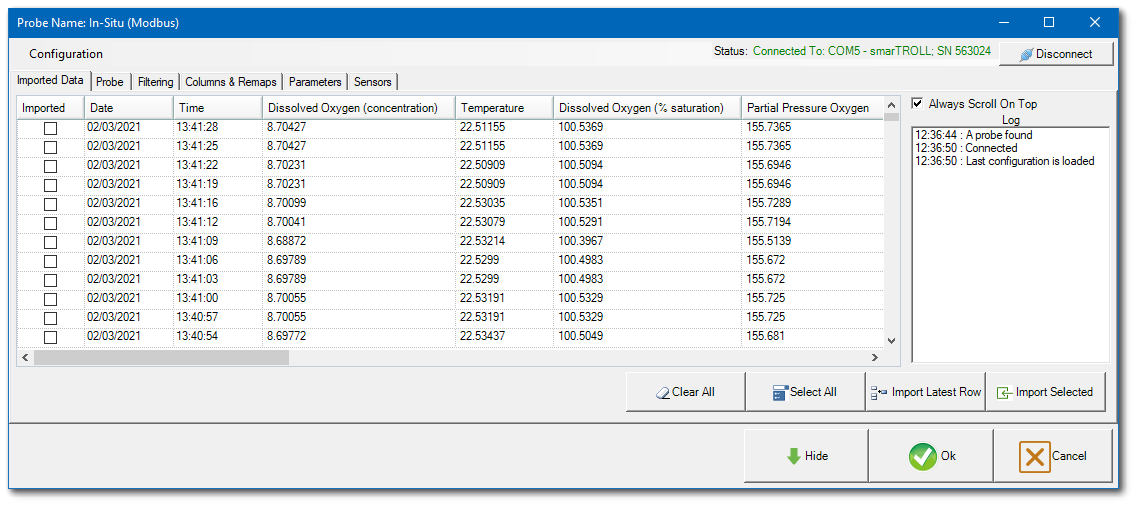
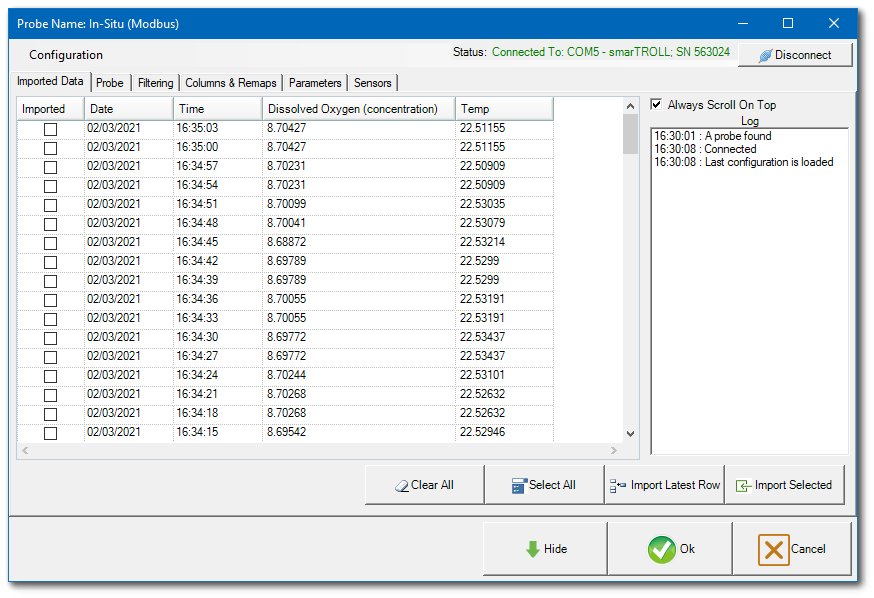
The Imported Data tab displays all real time data available from the connected sensor. Select the Always Scroll on Top check box to have the most recent data displaying at the top of the view grid.
Probe Tab
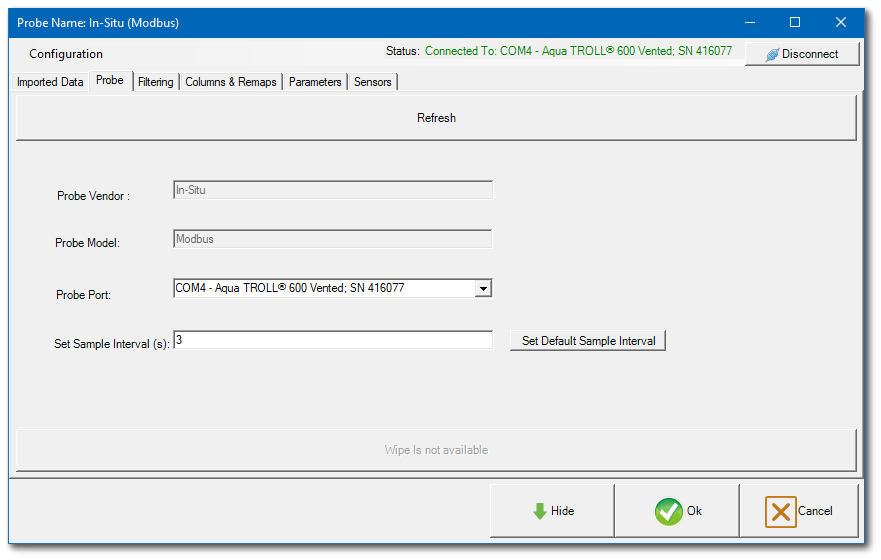
The Probe tab provides information about the probe, including the probe vendor, model, and port. Users are also able to set the interval (in seconds) to sample data from the probe. The maximum sample interval is 9999 seconds. To set the sample interval to the probe default, click the Set Default Sample Interval button.
Filtering Tab
The Filtering tab allows for selection of data being imported, including:
•Time Limitation – Allows trimming of imported data records (as captured on the Imported Data tab) by assigning a Start Time and End Time. An option is also available to automatically disconnect the probe after the End Time is reached.
•Record Limitation – Allows the user to select how many records will be added.
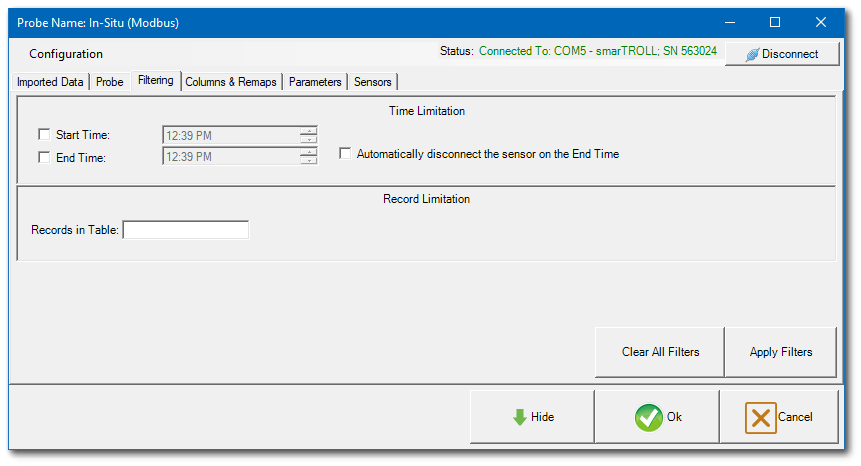
Two options are available at the bottom right of the Filtering tab:
•Apply Filters – Enables application of all settings selected in Time Limitation and Record Limitation.
•Clear All Filters – Allows for clearing of all settings selected in Time Limitation and Record Limitation.
Columns & Remaps Tab
The Columns & Remaps tab displays all parameters being imported.
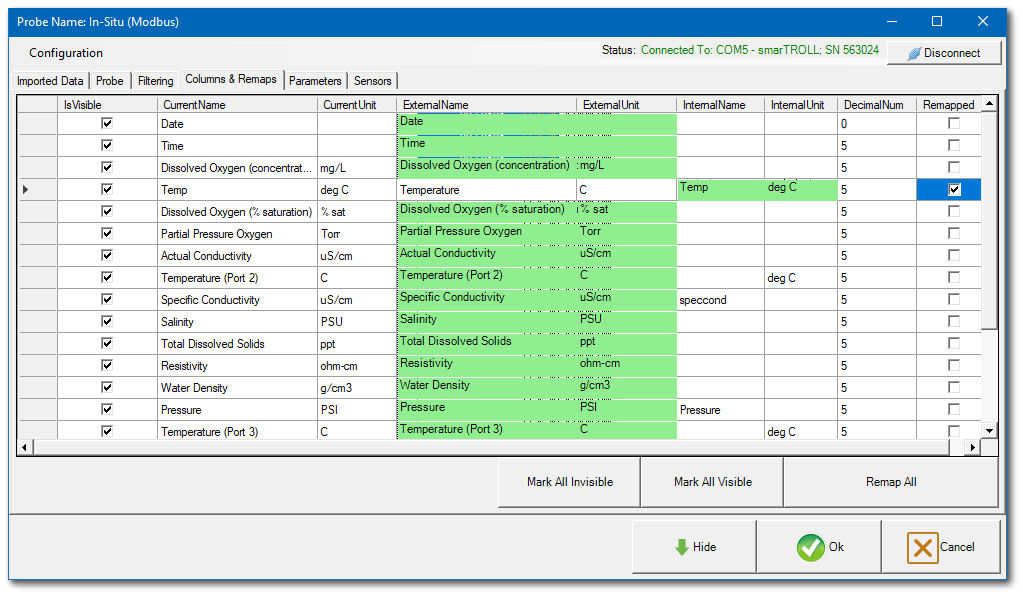
The following columns are available on the tab:
IsVisible – Allows selection of the parameters visible for data import. Only the parameters checked as IsVisible in this tab will show in the Imported Data tab. The Date, Time, Dissolved Oxygen, and Temp parameters were selected to be visible in the example image below.
CurrentName and CurrentUnit – Displays the name and corresponding units of the imported parameters.
ExternalName and ExternalUnit – Parameters as imported from the sensor.
InternalName and InternalUnit – Parameters as imported in EDGE from the selected reference value file (RVF) file.
DecimalNum – Allows trimming the number of decimals recorded in EDGE from selected parameters. The maximum number of decimals is set to 10. Any number exceeding 10 will default to 10.
Remapped – Allows selection of parameters to be remapped after import if the remapping has been defined and imported in the RVF file (see the Field Logger Import article).
Three other options are available on the bottom right of the Columns & Remaps tab:
•Mark All Invisible – Allows users to to mark all rows as invisible.
•Mark All Visible – Allows users to mark all rows as visible.
•Remap All – Selects all parameters to be remapped.
Individual selection/deselection of each row in these column is available by clicking in the specific check box.
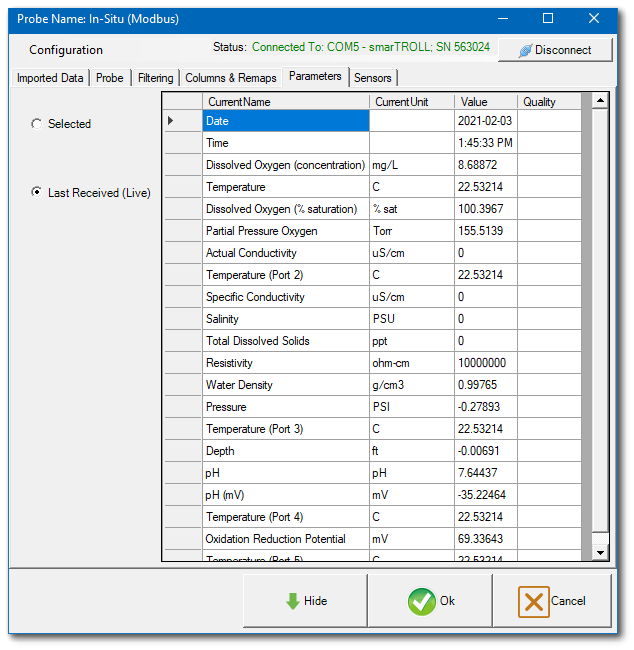
Parameters Tab
The Parameters tab displays the imported parameters as Selected or Last Received. The Selected option displays the last row of selected data to be imported. The Last Received Data (Live) option displays the last row of received data.
Sensors Tab
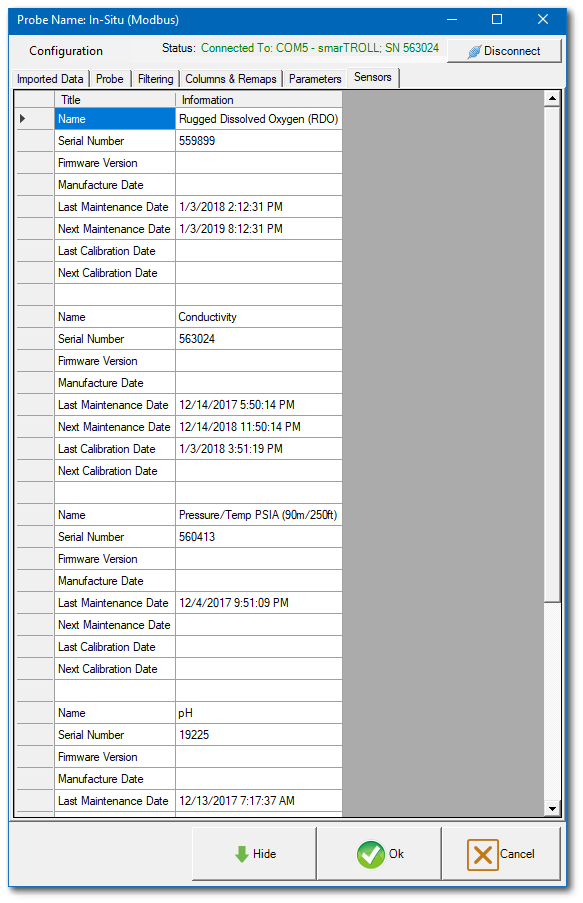
The Sensors tab provides detailed information about each of the sensors used to gather the data.
