A variety of map layer types can be added to the Collect Enterprise Map page and include:
•User Report Layer
•Feature Layer
•ArcGIS Dynamic Layer
•ArcGIS Tile Layer
•GeoRSS Layer
•KML Layer
•Image Layer
•Vector Tile Layer
•CSV Layer
Create a New Map Layer
To create a new map layer, select the Map page and then select the Setup button on the upper right corner of the Map page frame.
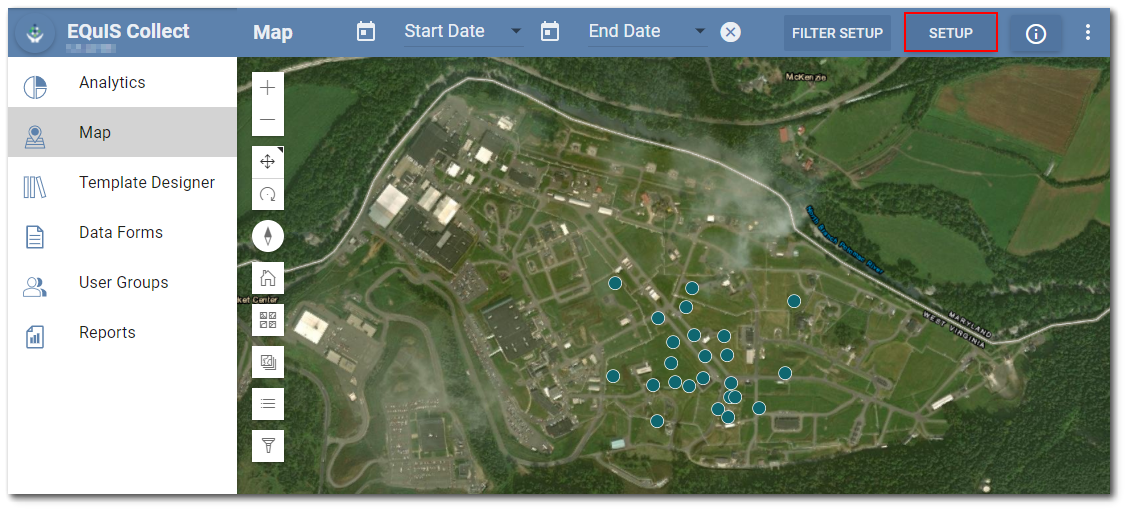
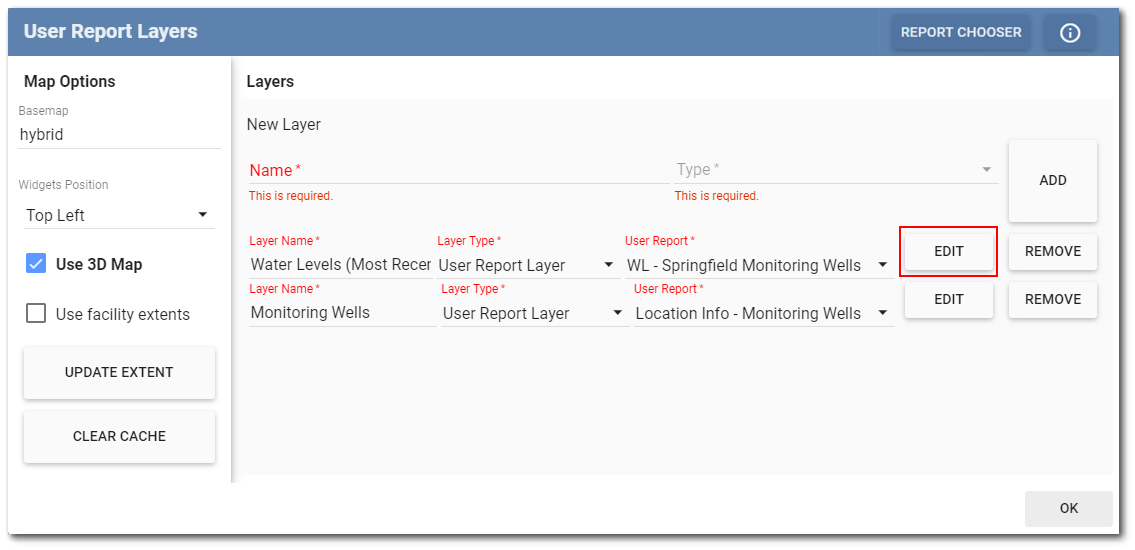
The User Report Layers window will open displaying any already existing map layers.
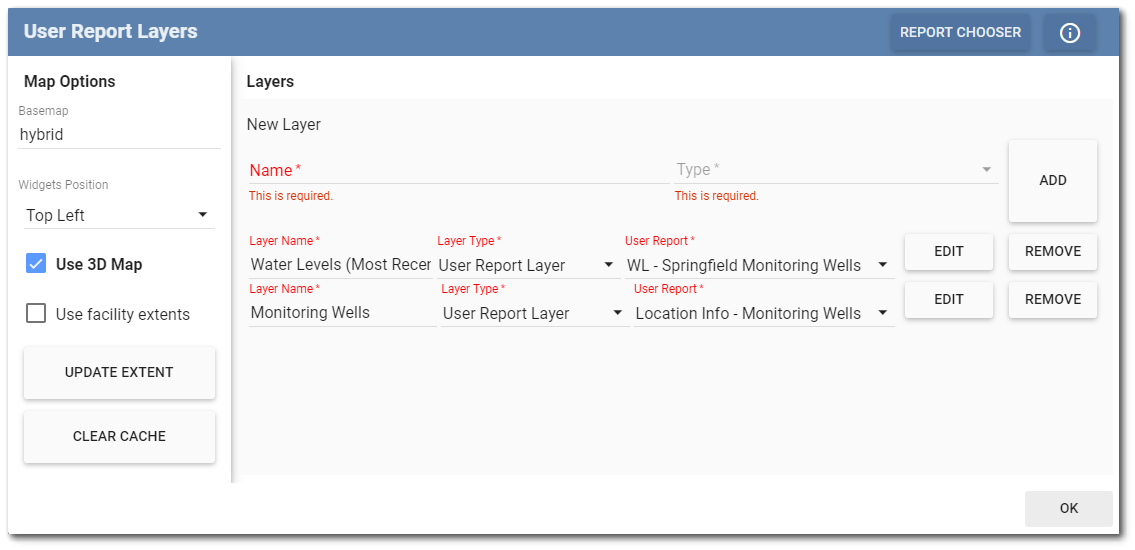
To add a new layer to the map, click the Layer Type drop-down menu and select the desired map layer type.
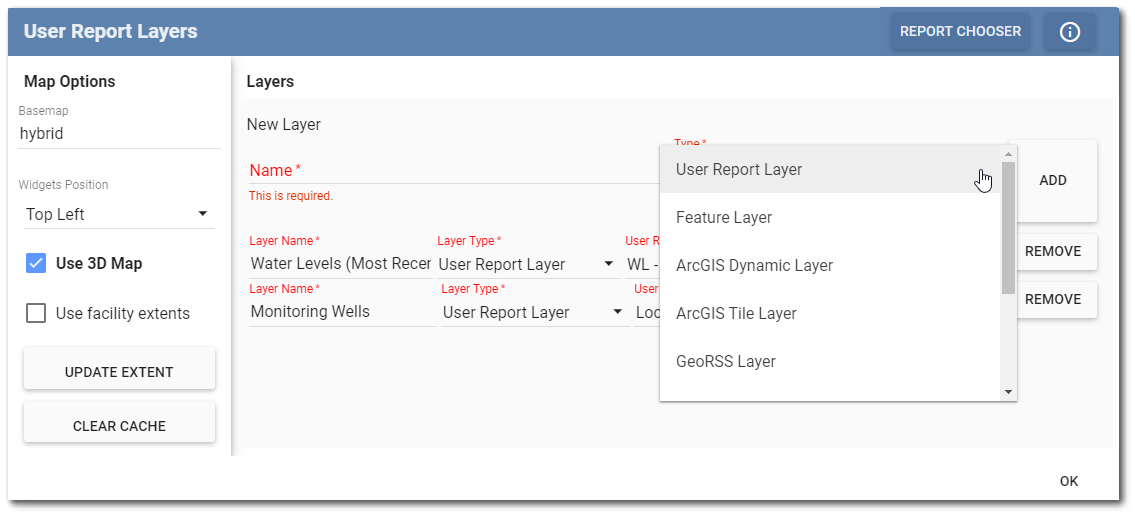
Enter a Name for the new layer and click the Add button.
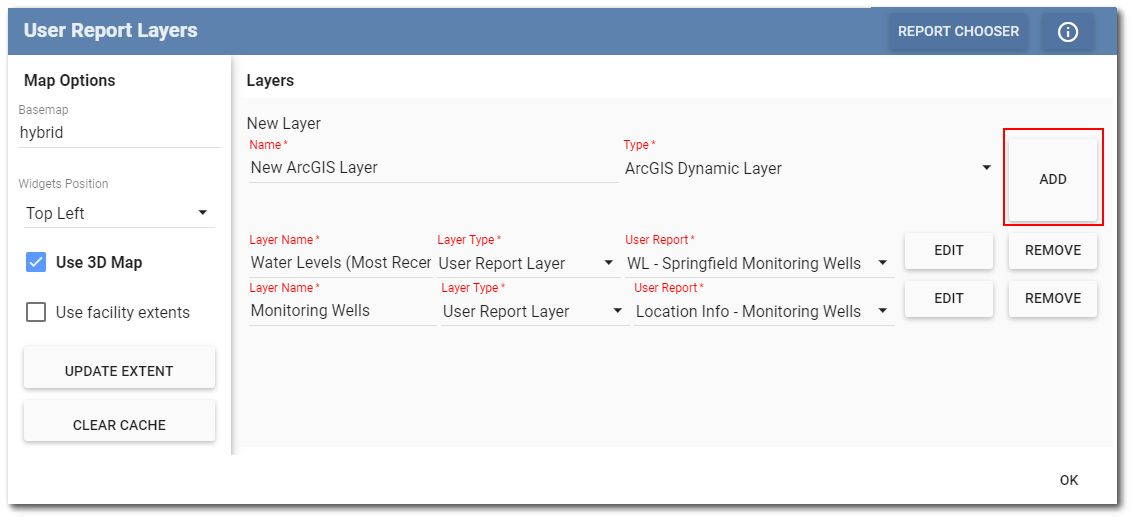
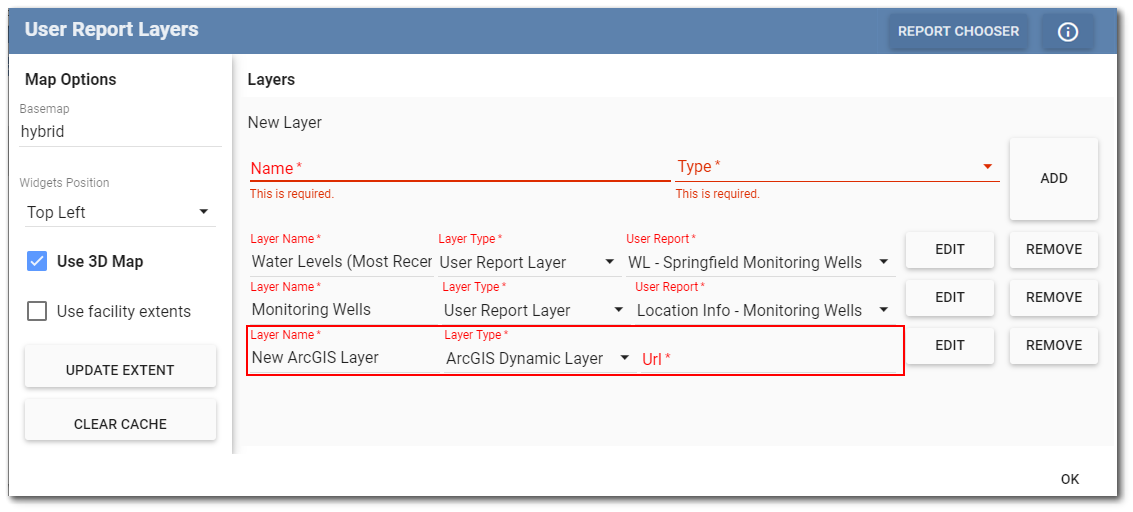
If a user report was selected as the map layer type, click the drop-down menu to choose from available user reports. Note that the report must contain X_COORD, Y_COORD and a date field to see it on the map. If another layer type was chosen, enter an appropriate URL for the map layer source. Click the OK button to add the new map layer(s).
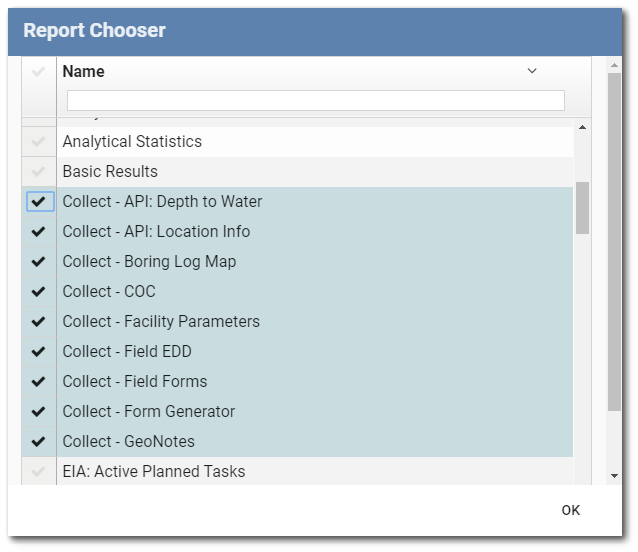
To add a standard EQuIS report, select the Report Chooser button on the upper right corner of the User Report Layers window frame. The Report Chooser window opens and displays available reports. Click the check box for the desired report and click the OK button.
Edit a Map Layer
Select the Setup button on the upper right corner of the Map page frame. The User Report Layers window opens displaying the available map layers. Click the Edit button to open the Editing window for the desire map layer.
Make all the desired changes in the Editing window. Enter a title in the Title Content text box. The title can contain field names. In the Main Content text box, enter text and/or field names to be displayed on the map when the symbol is clicked. To select field names for the Title Content and Main Content text boxes, place the cursor into the desired text box and click the field value. The list of field names pertinent to the selected report is displayed in the right pane. Field values can also be manually entered by typing in the desired field name from the right hand side. Place the field name in brackets {} to show the value of the field. To have more than one field displayed hit the Enter key to add another line.
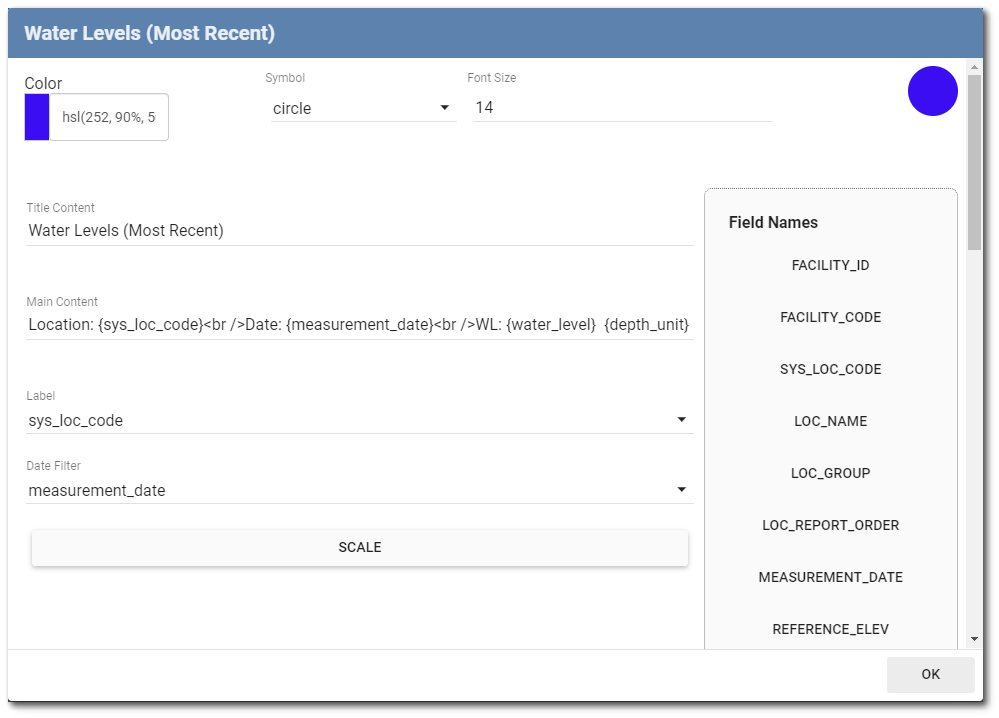
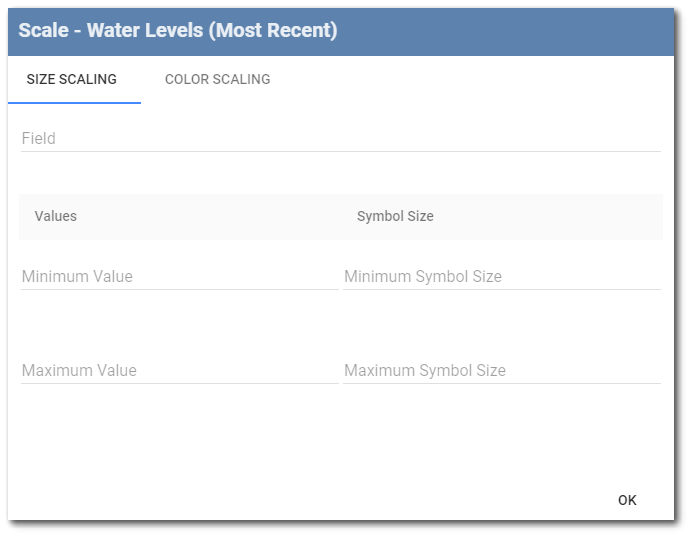
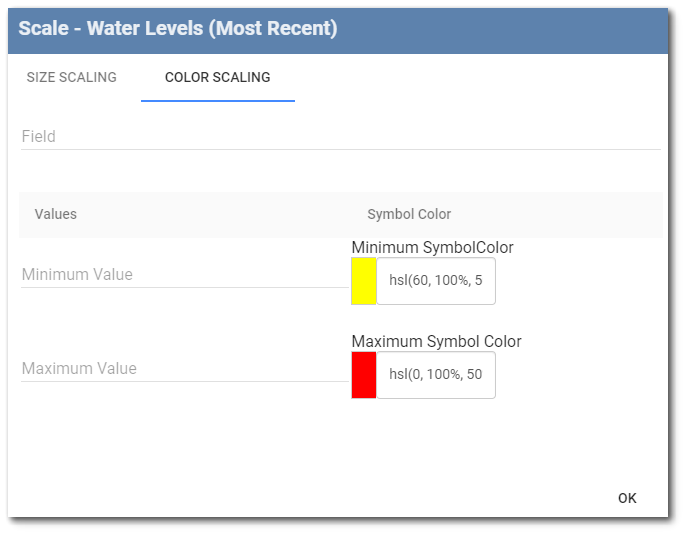
At the top of the Editing window, select from several options to change the Color, Symbol, and Font Size. The symbols displayed on the map can be adjusted for both Size and Color. Select the Scale button at the bottom of the window to open the Size and Color Scale window. Select either the Size Scaling or Color Scaling tab at the top. Once Size or Color Scaling are selected, choose a numeric field from within the drop-down menu for Field. Once a field is selected, set the minimum and maximum values, sizes, and/or colors. Click the OK button to save changes and return to the Editing window.
Click the OK button to save changes to the Editing window and return to the User Report Layers window.
View a Map Layer
Once a map layer is created, it shows as a new layer in the drop-down menu under the Expand Layer ![]() button and any map symbols will display on the map with the label.
button and any map symbols will display on the map with the label.
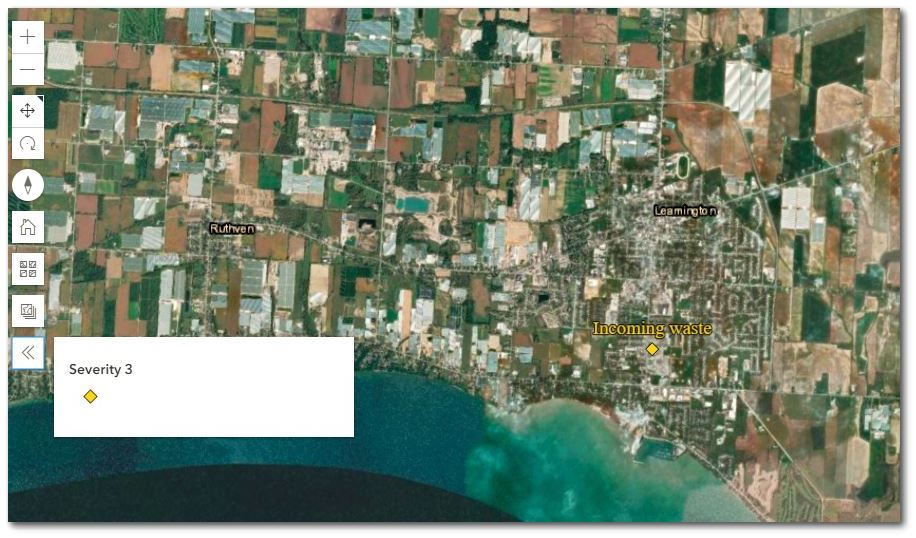
For user reports, click on the symbol to view information associated with the report in a pop-up window.
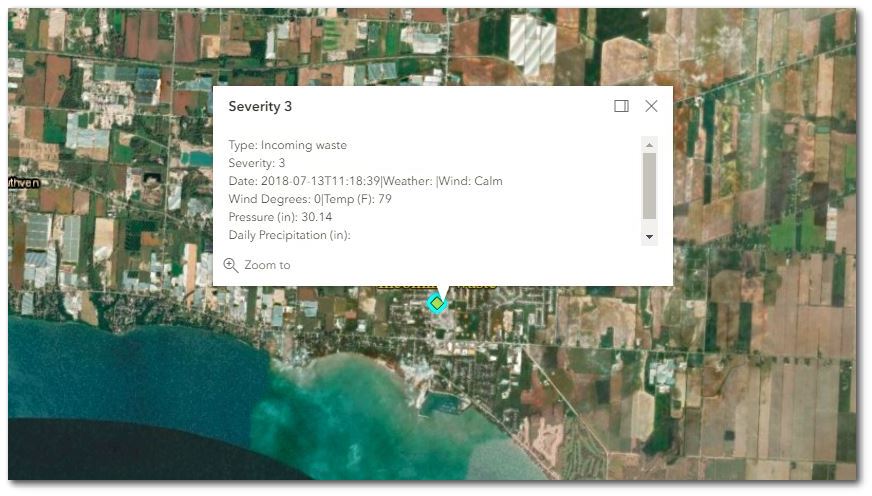
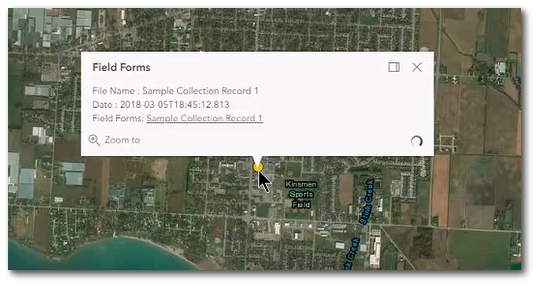
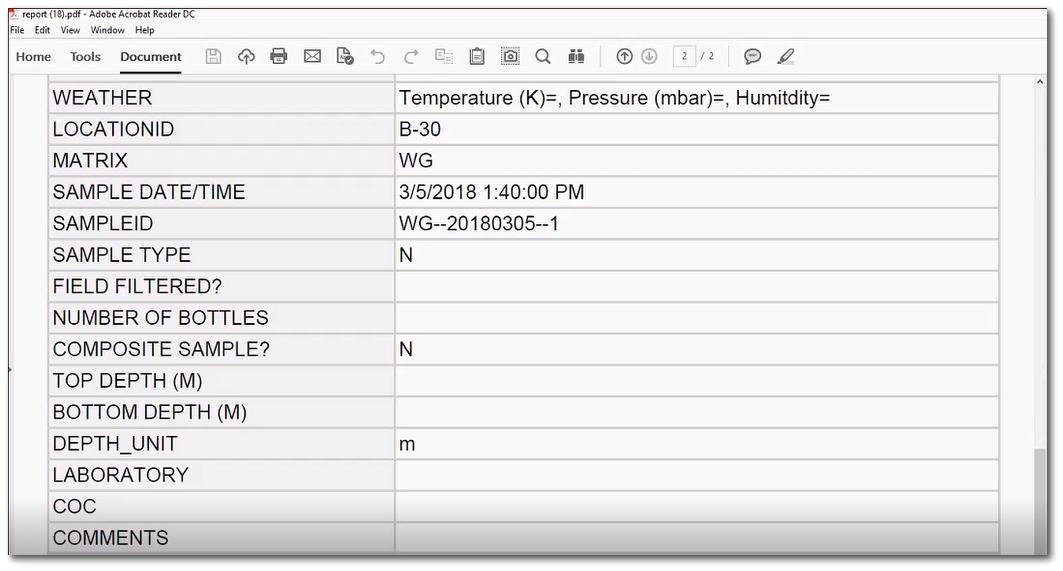
If files are associated with the report, they can be displayed or downloaded from the map. In the following example, the report displays the Field Forms and their location on the map. Clicking on the report posted location, the Field Form box is shown with a direct link to the published form. Clicking on the link displays the published form.
|
|
